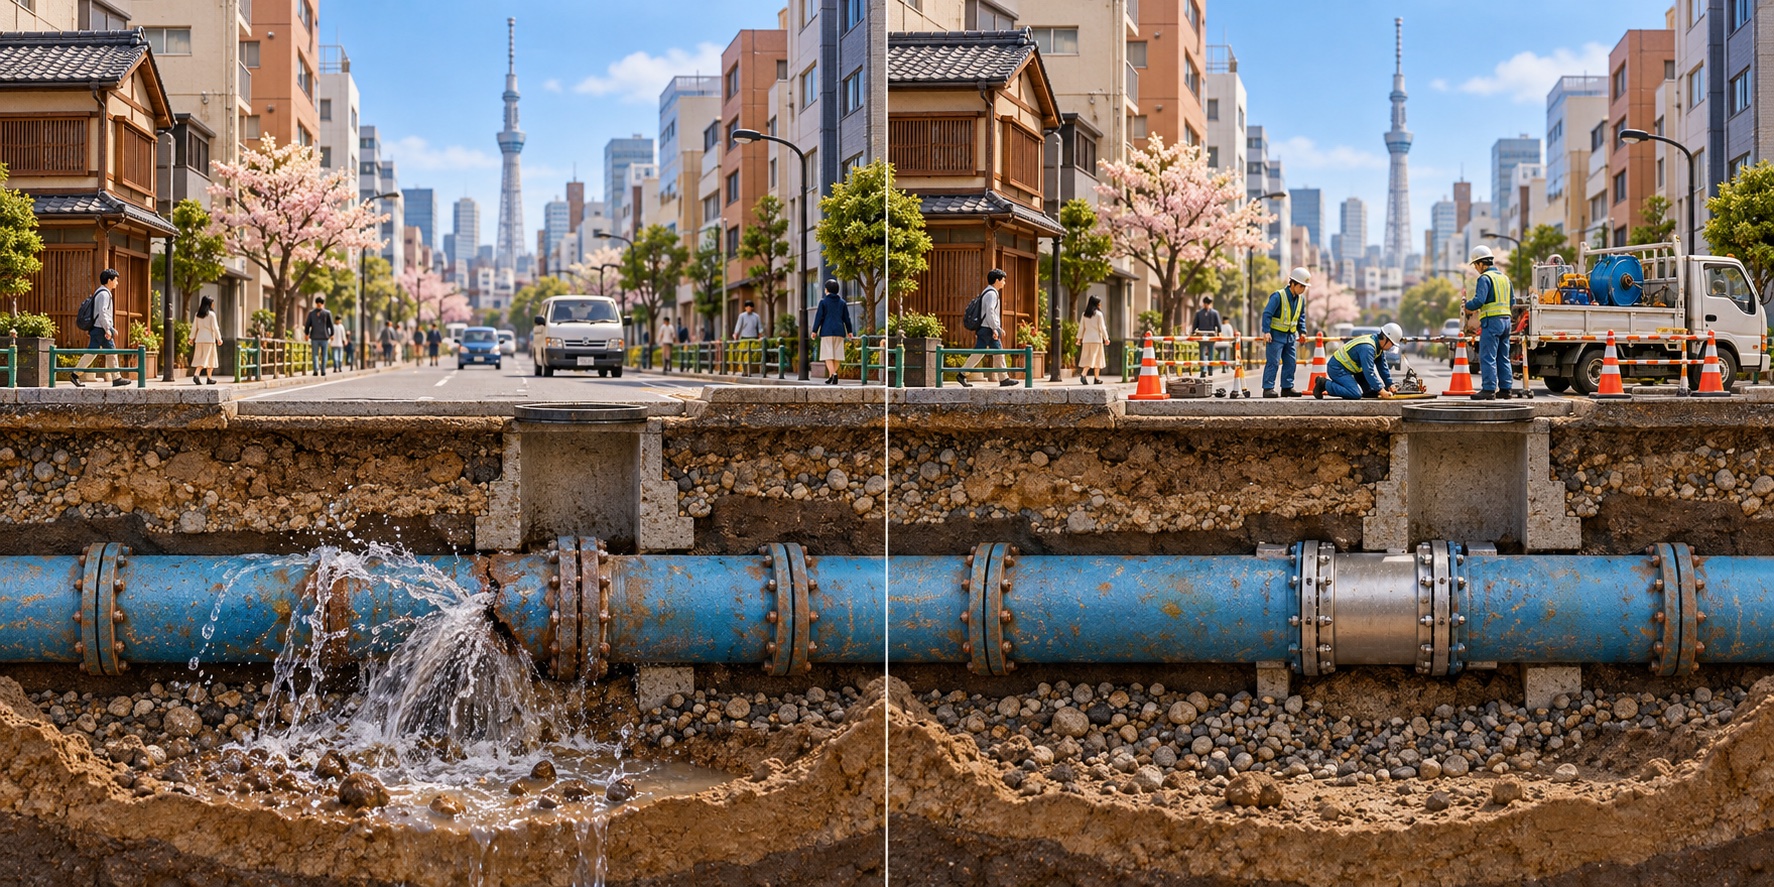
How the change works
- 01 / Public decision
Investments in the network
- 02 / Physical change
Losses detected and repaired
- 03 / Possible outcome
More water reaches users
Repairing a network avoids taking, treating and pumping water that won't reach anyone.
Research and local documents ↓What the evidence tells us
In the series published by the Tokyo Bureau of Waterworks, the loss rate falls from 10.2% in fiscal year 1992 to 2.7% in 2010. The program combines pipeline maintenance, surveying, and renewal.
The water lost by the Tokyo network
10.2 % of loss1992
2.7 % of loss2010
Tokyo Bureau of Waterworks series. Percentage of loss, not absolute volume nor isolated effect of a technique.
Open the source ↗Read values and method
| Indicator | Value |
|---|---|
| 1992 | 10.2 % of loss |
| 2010 | 2.7 % of loss |
Tokyo Bureau of Waterworks series. Percentage of loss, not absolute volume nor isolated effect of a technique.
Putting the choices into practice
Detection
The challengeWaiting for a visible pipe break
The responseFinding hidden leaks
Maintenance
The challengeOccasional repairs
The responsePlanned pipe replacement
Indicator
The challengeInlet water only
The responseLosses and volumes delivered
The diagram compares choices and conditions for putting them into practice. Measured outcomes and their limits are discussed in the evidence.
Research and local documents ↓Conditions and limits
The comparison is a series of the manager, not a causal estimate of a single technique. Percentage rate and absolute volume lost are different indicators.
Other possible benefits
Less waste of labor and energy already used to make water available.
Research and local documents
- Local project or policy documentTokyo Bureau of Waterworks · Energy Saving through Water Leakage Control ↗
Institutional documentation of the program, territory or rules mentioned.

