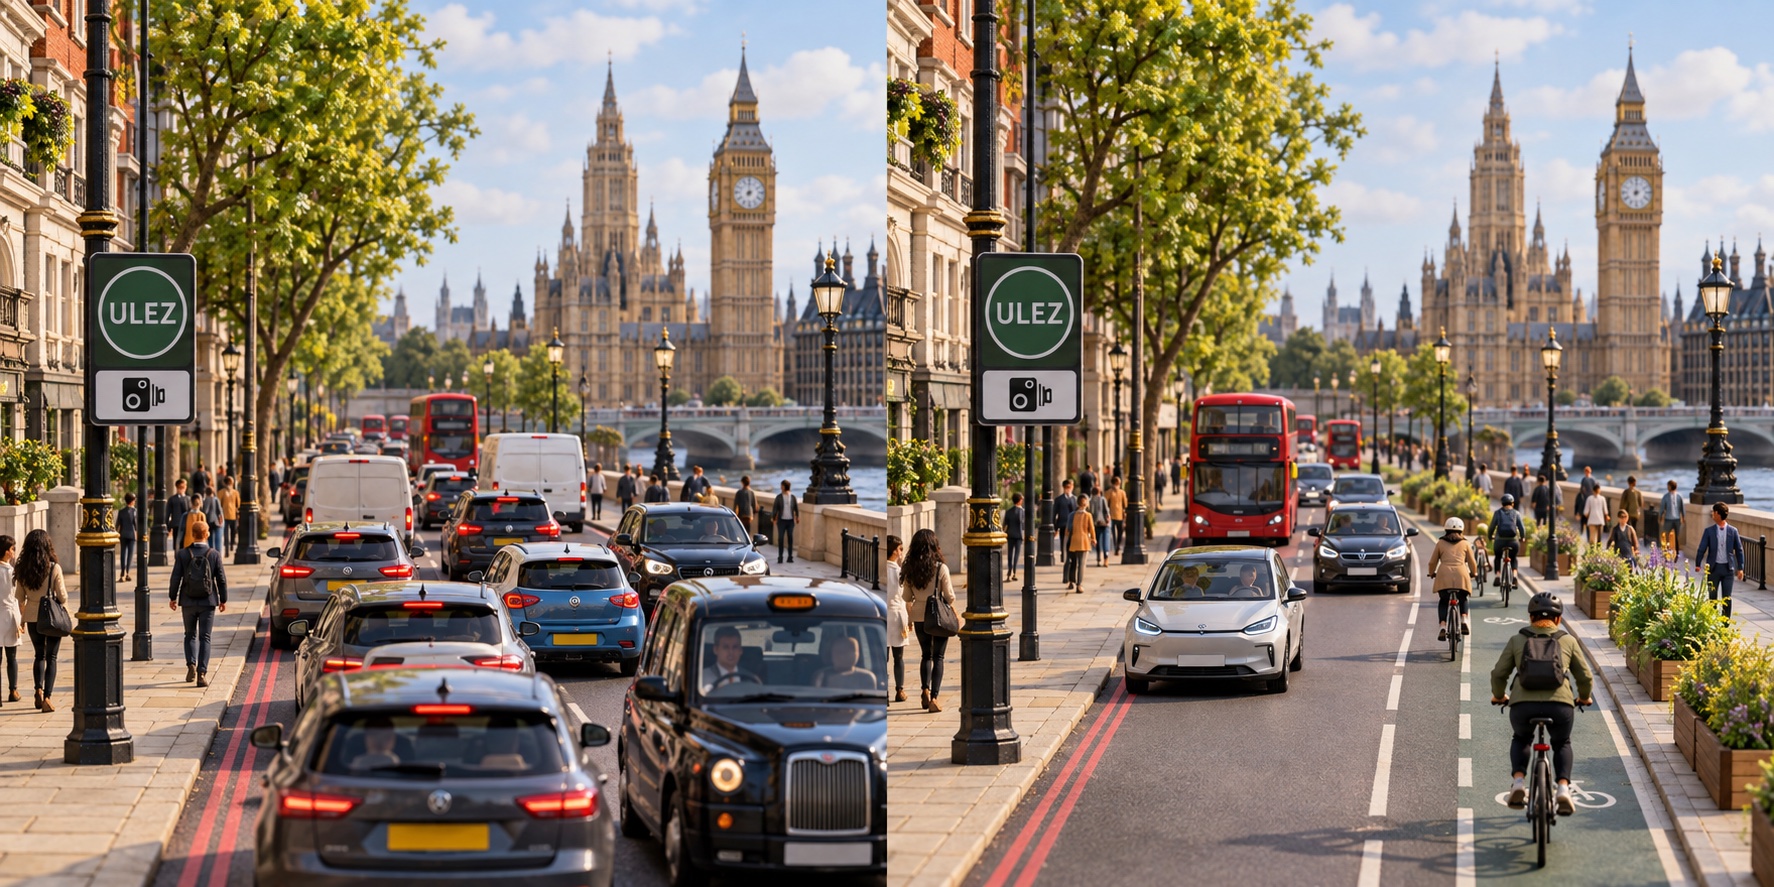
How the change works
- 01 / Public decision
Rules and supports
- 02 / Physical change
Less polluting fleet
- 03 / Possible outcome
NO₂ to measure
A low-emission zone can reduce road pollutants by changing which vehicles circulate and accompanying the transition.
Research and local documents ↓What the evidence tells us
The London report of March 2025 estimates a 27% lower road NO₂ for 2024 than the scenario without all the phases of the ULEZ. The 2023 extension alone has a distinct and smaller effect.
Road NO₂: two scenarios for 2024
100 index · without ULEZ = 100Estimated scenario without ULEZ
73 index · without ULEZ = 100With ULEZ, relative index
Index derived from the GLA estimate of 27% lower. It is not a concentration in µg/m³ nor the observed annual drop.
Open the source ↗Read values and method
| Indicator | Value |
|---|---|
| Estimated scenario without ULEZ | 100 index · without ULEZ = 100 |
| With ULEZ, relative index | 73 index · without ULEZ = 100 |
Index derived from the GLA estimate of 27% lower. It is not a concentration in µg/m³ nor the observed annual drop.
Putting the choices into practice
Rule
The challengeSame accesses for each vehicle
The responseEmission standard
Valuation
The challengeAnnual comparison only
The responseScenario without the policy
Fairness
The challengeNo help
The responseAlternatives and supports
The diagram compares choices and conditions for putting them into practice. Measured outcomes and their limits are discussed in the evidence.
Research and local documents ↓Conditions and limits
27% is a modeled comparison, not the annual decline. It doesn't measure CO₂, traffic, or accessibility by itself.
Other possible benefits
Better air on the streets and pay attention to those who have fewer alternatives.
Research and local documents
- Local document and reported findingGreater London Authority · London-wide ULEZ One Year Report, 2025 ↗
Municipal assessment with scenario without ULEZ and review of the method by independent experts.
- Local project or policy documentTransport for London · ULEZ, documents and reports ↗
Documentation for consultation, application and monitoring of the different phases.

