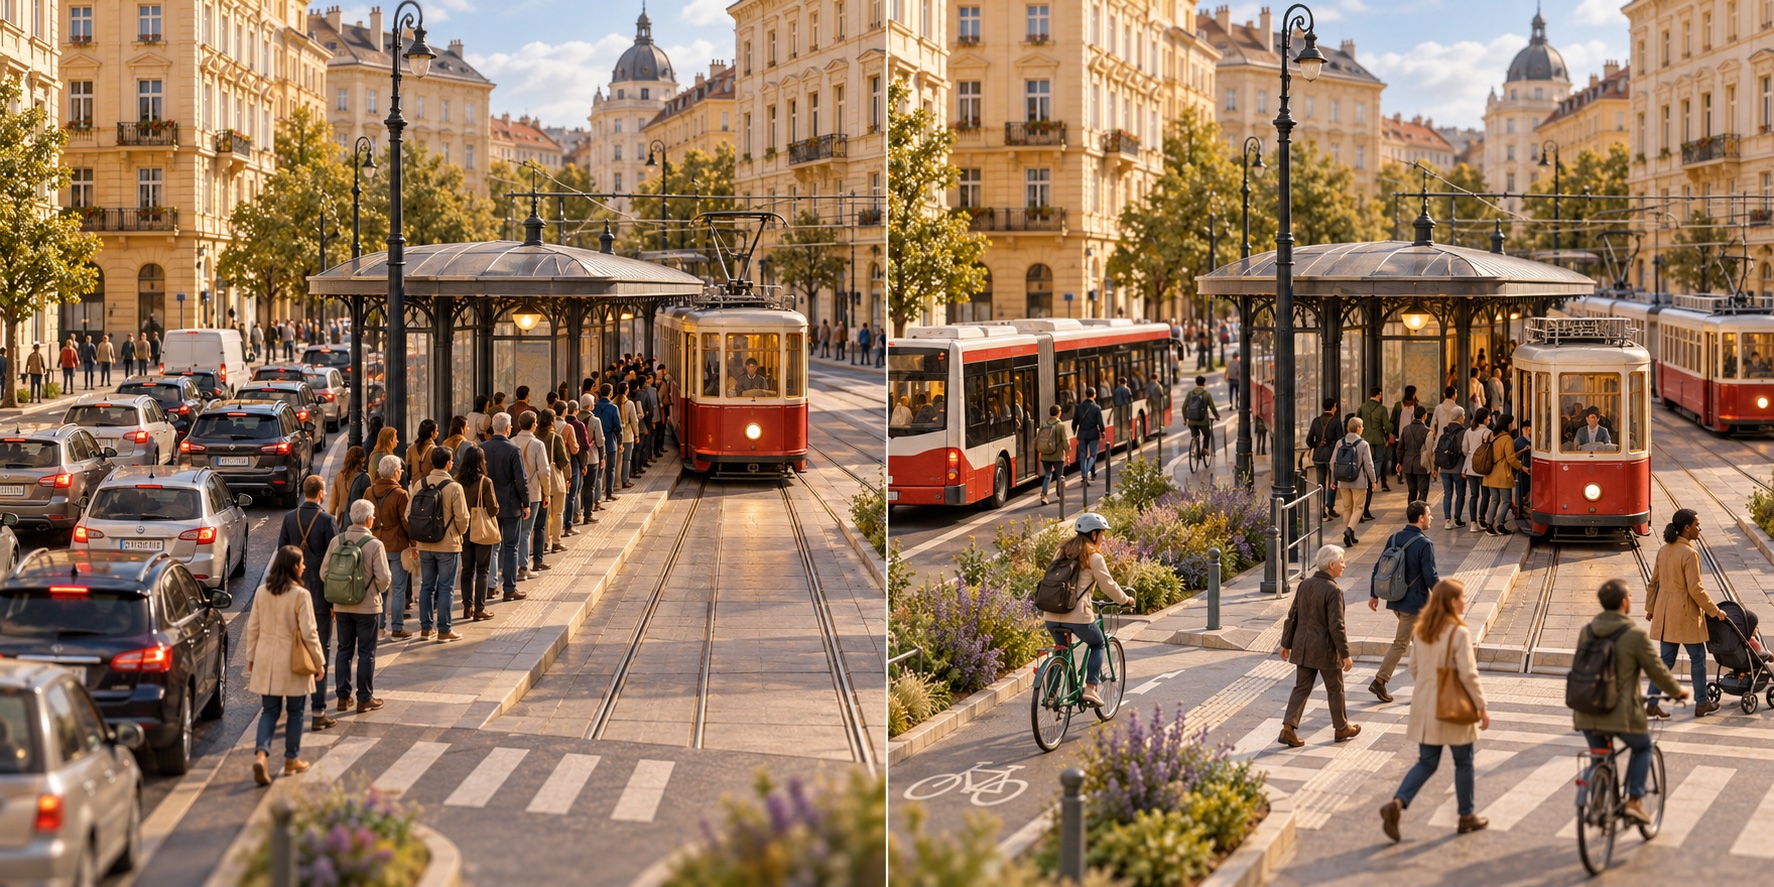
Illustrated comparison inspired by the place and case. Conceptual scenes, not a photographic before and after.
How the change works
- 01 / Public decision
Subscription, network and frequencies
- 02 / Physical change
More viable alternatives to the car
- 03 / Possible outcome
Lower number of trips by car
Price, frequency, capillarity and parking management together influence the possibility of giving up a car trip.
Research and local documents ↓What the evidence tells us
Vienna documents a share of cars increased from 40% of trips in 1993 to 25% in 2024, together with decades of investment and urban policies.
The share of trips by car
40 %1993
25 %2024
Difference: 15 percentage points. The comparison describes an observed change, not the isolated effect of the subscription price.
Open the source ↗Read values and method
| Indicator | Value |
|---|---|
| 1993 | 40 % |
| 2024 | 25 % |
Difference: 15 percentage points. The comparison describes an observed change, not the isolated effect of the subscription price.
Conditions and limits
We don't attribute the change to the subscription price alone. The comparison with Luxembourg does not prove that free will be ineffective everywhere.
Other possible benefits
Accessibility of services for those who do not own a car.
Research and local documents
- Local document and reported findingStadt Wien · Wien-Plan, data as of 2024 ↗
Vienna documents a share of cars increased from 40% of trips in 1993 to 25% in 2024, together with decades of investment and urban policies.
- Scientific basis of the mechanismIPCC AR6 WGIII · Chapter 10: Transport, 2022 ↗
Scientific synthesis of the mechanism: active mobility, collective transport, efficiency and energy mix. It is not a causal assessment of the individual local project.
